Advanced Topic Skip if you’re new, explore when you’re ready.
Bottango has an animation graph view, which allows you to view and edit the interpolation of your keyframes. This is a powerful tool that lets you fine-tune your performance to a high level of precision and artistic intent.
Imagine the most basic movement between two poses: animating at a linear, constant speed. A hand, for example, could start in one position, and then move at a constant rate until it reaches its destination. It’s easy to imagine all kinds of more interesting alternatives:
The hand starts moving slowly and then rushes to its final resting spot where it stops suddenly.
Or
The hand moves back slightly before springing forward to its final resting spot.
Both of the above involve moving from one point to another, but have so much more visual interest and character. You use the animation graph view in Bottango to control how a robot moves between each keyframe.
The default view in the animation window is the “dope sheet.” This is the view we used throughout the previous pages, creating and editing keyframes.
Press the graph icon to switch to the graph view:
When you enter the graph view, if you have no tracks selected, there will not be any graphs shown.
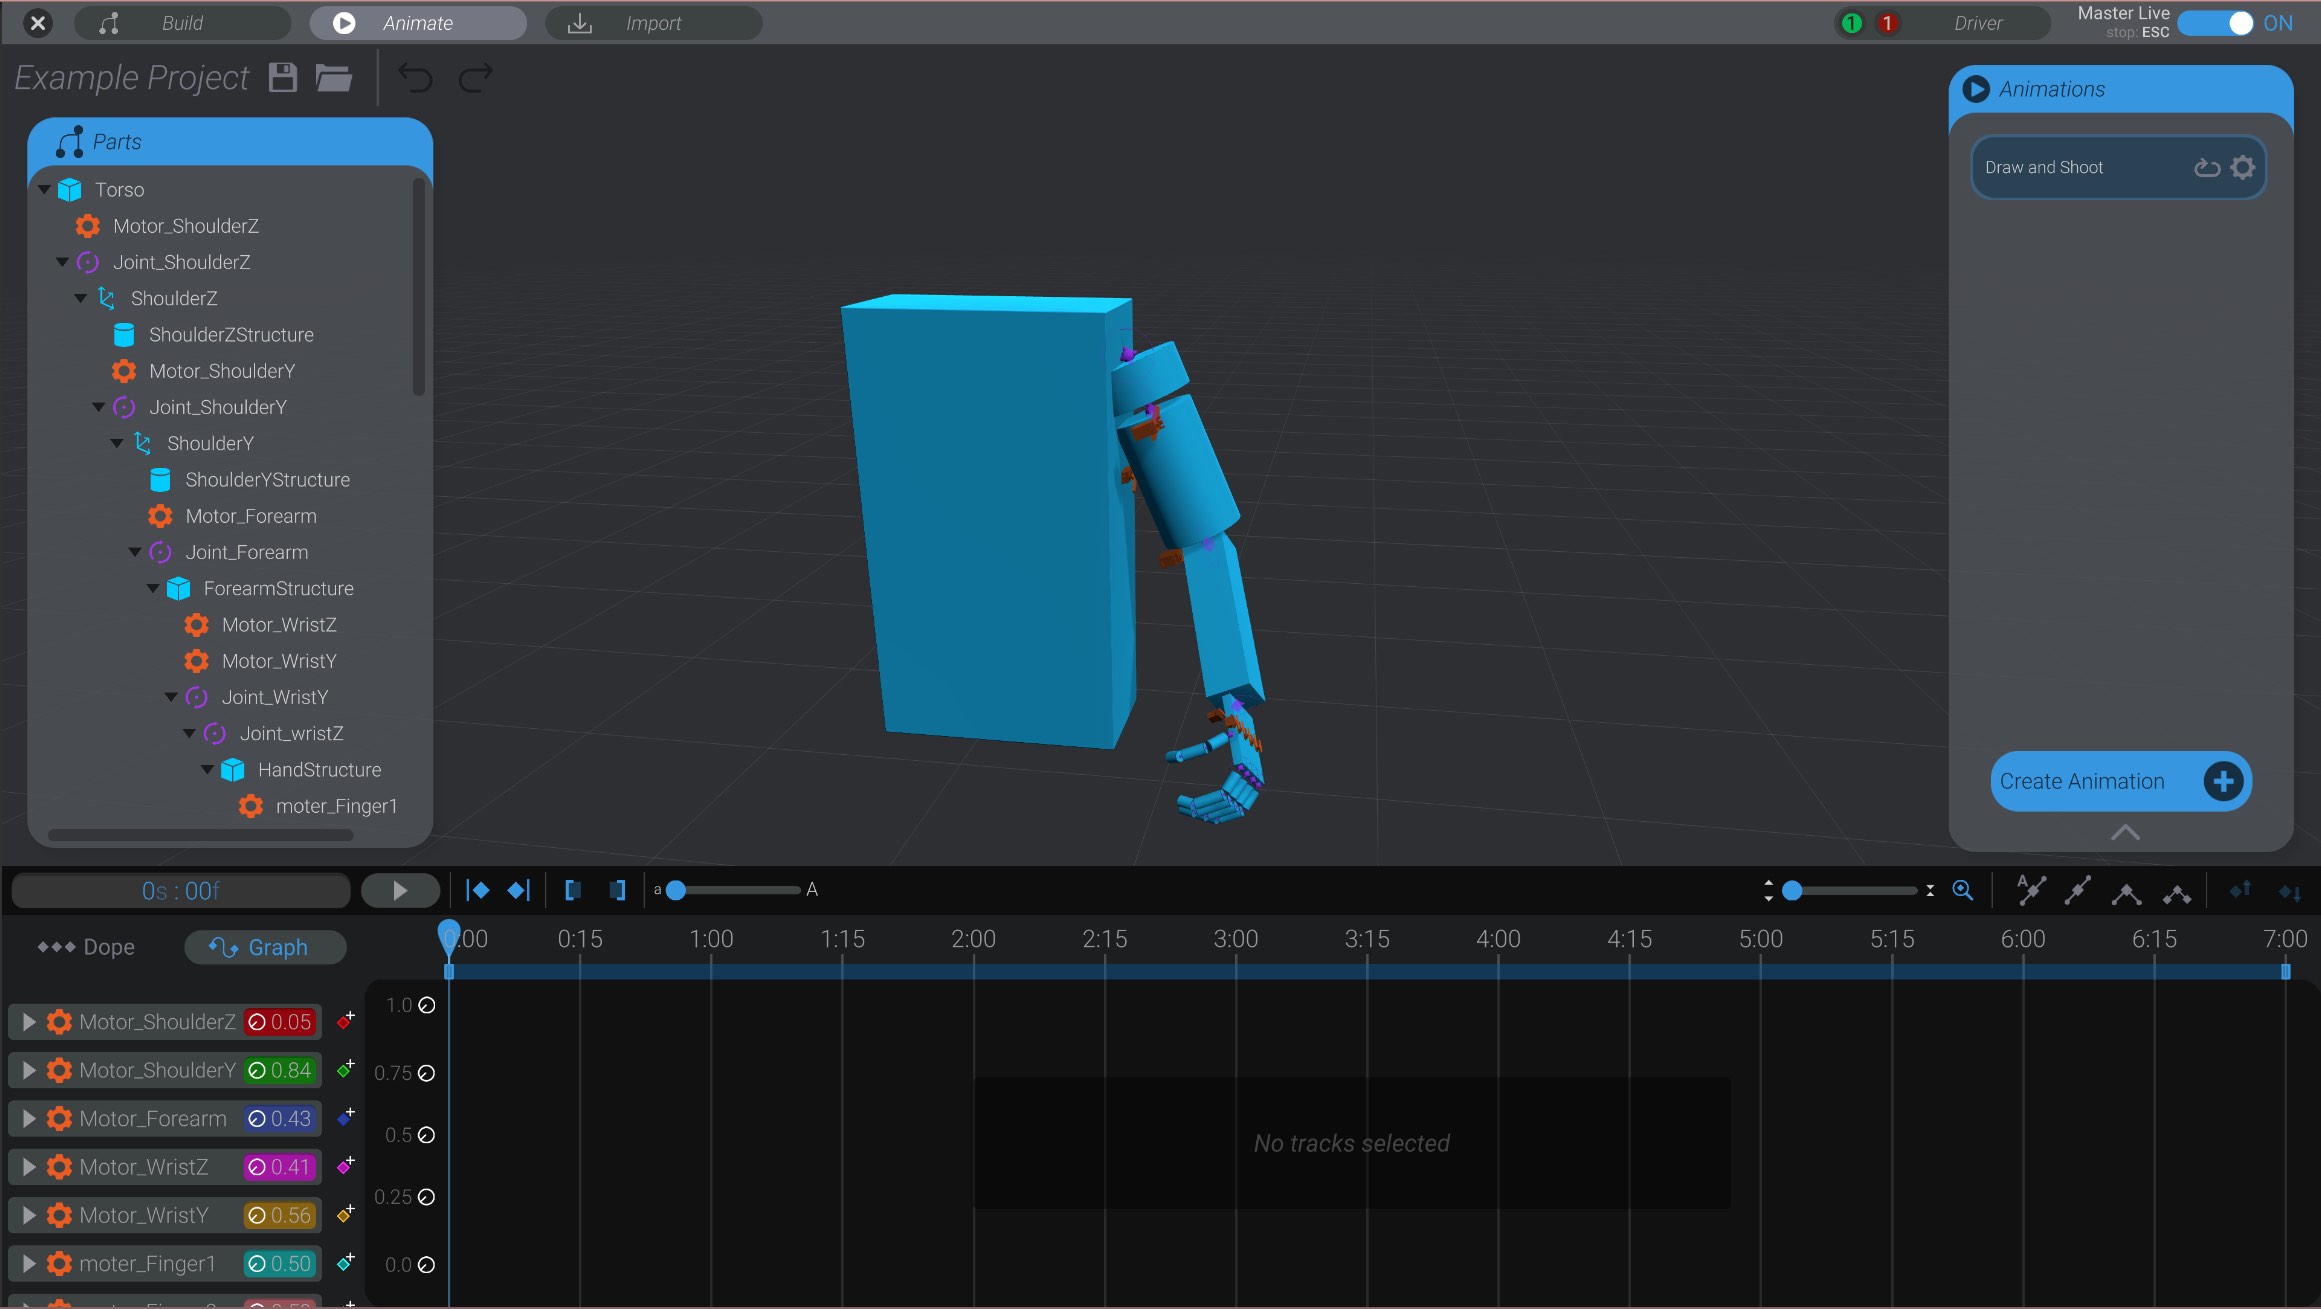
In order to view graphs, you need to select either tracks in the tracks list or joints in the 3D view of your robot. The graph view will always show the graphs of selected tracks or joints (or nothing if there is no current selection).
Just like in the dope sheet view, the graph view shows time in the X axis. However, the dope sheet view just uses the X axis. The graph view shows the calculated movement of each animation track in the Y axis over time.
What this means is best illustrated in examples.
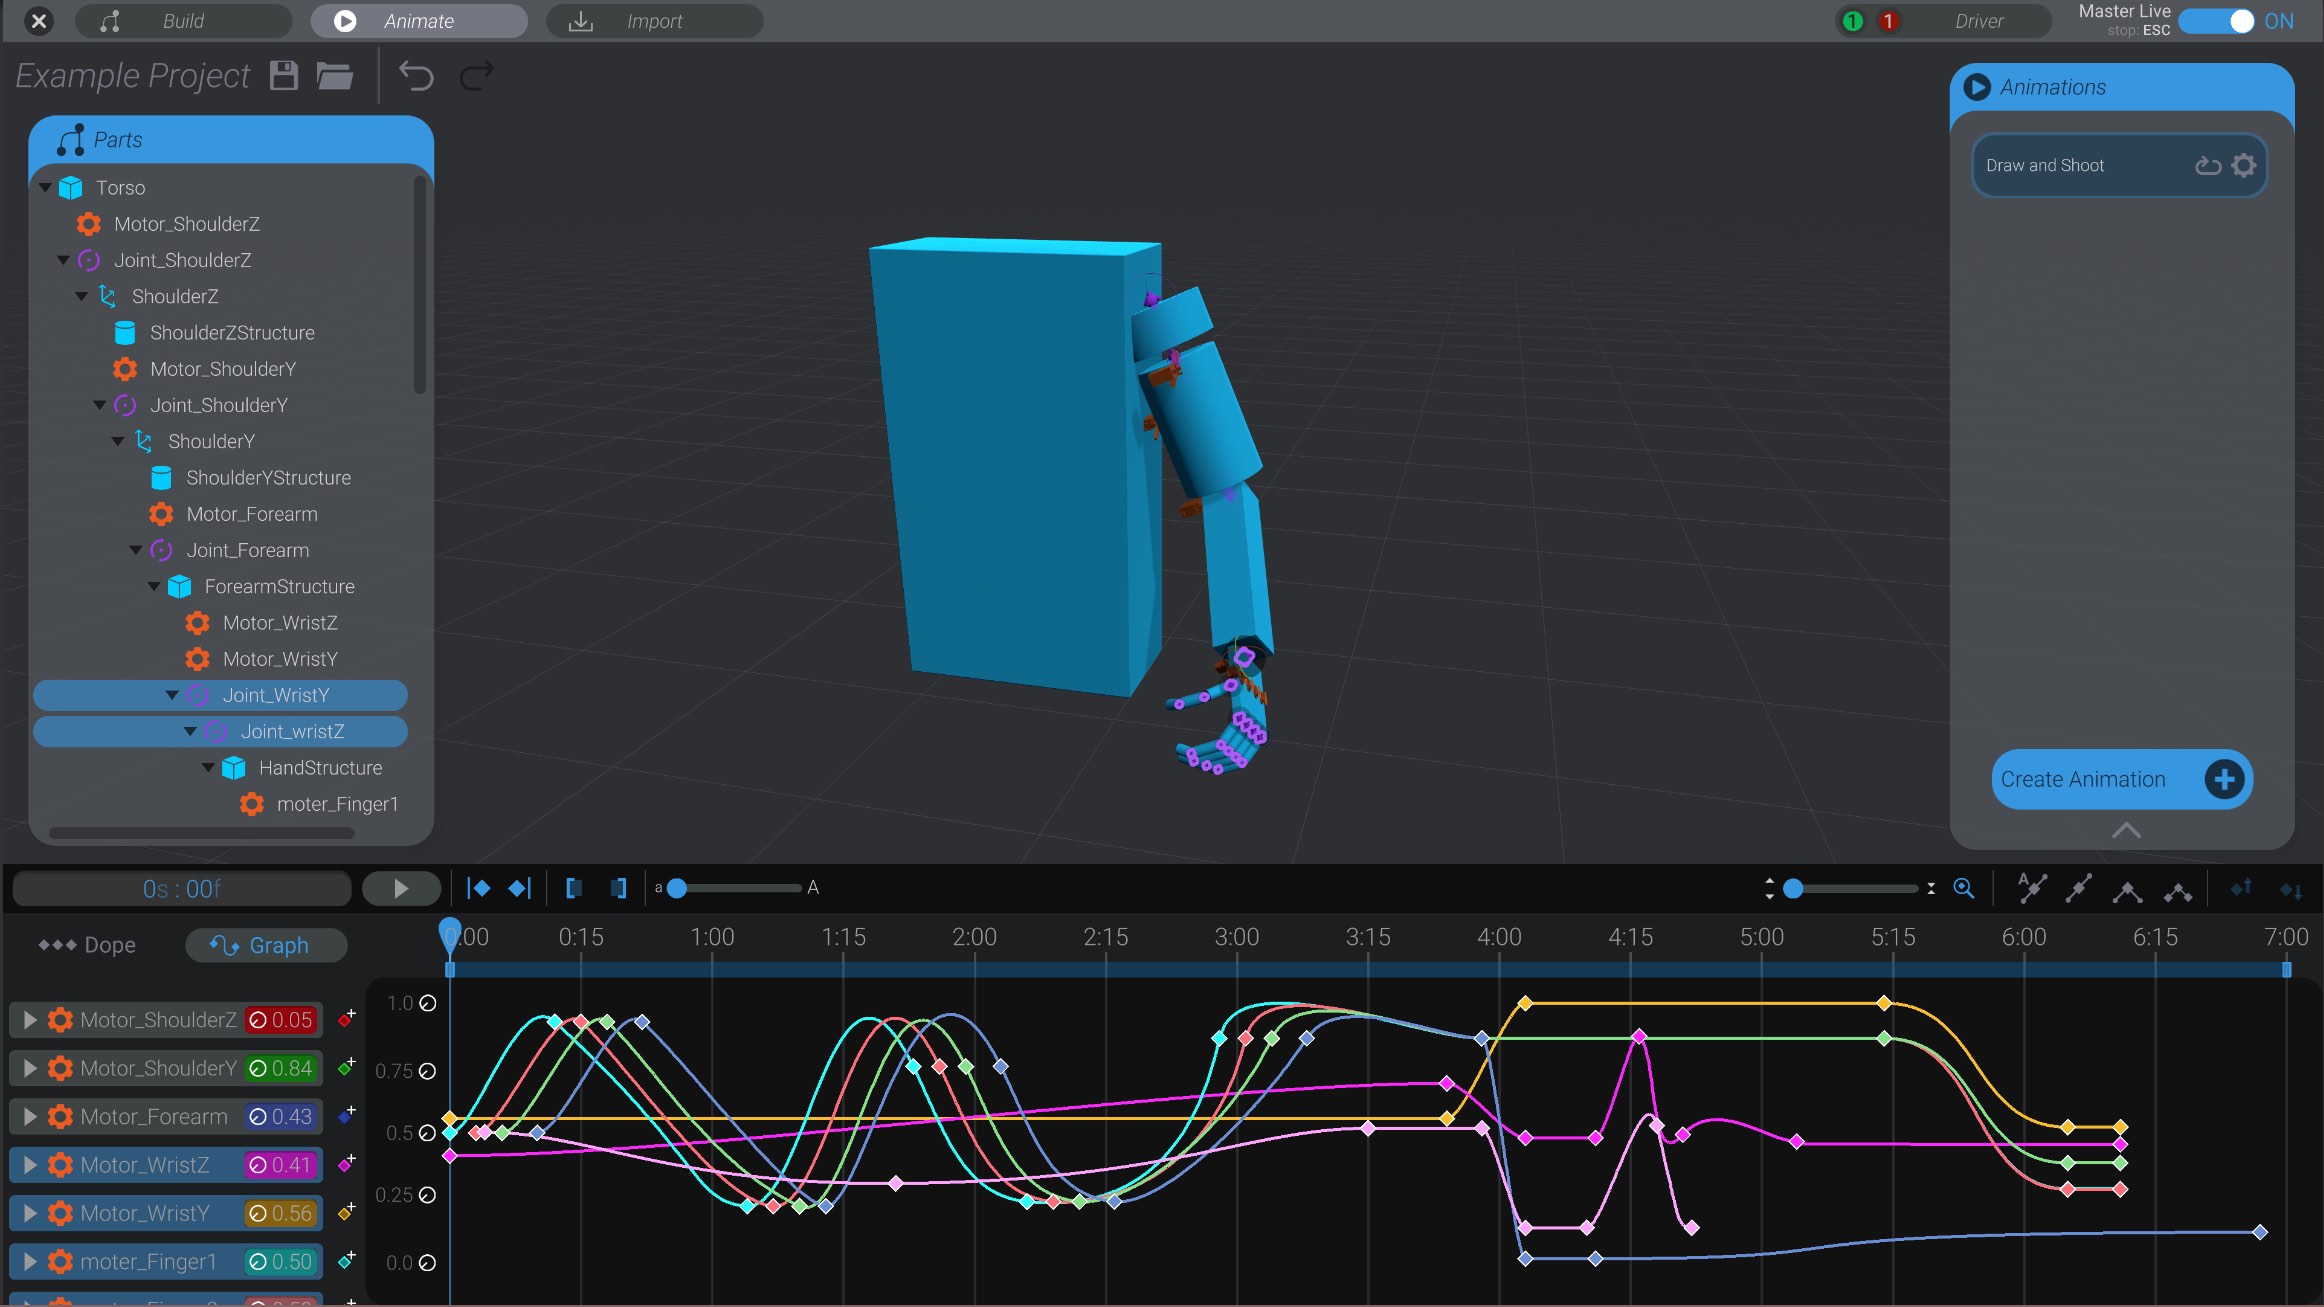
To start, here’s the most basic movement type: a linear, constant speed. This is the example of a hand moving at a constant rate until it reaches its final destination, then stopping:
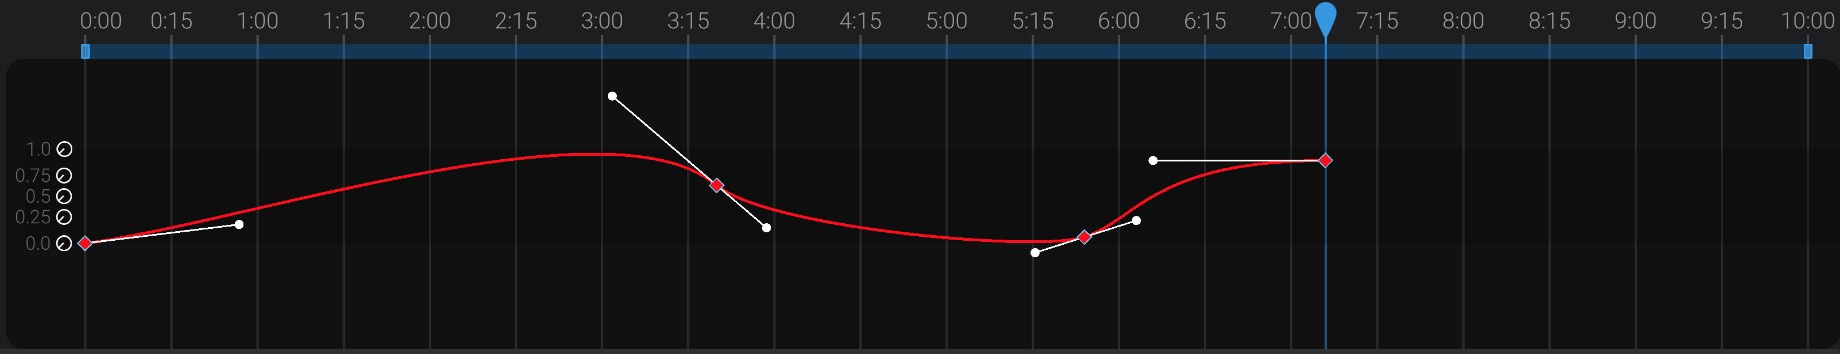
Here is the hand moving slowly in the beginning, and then rushing to a screeching stop:
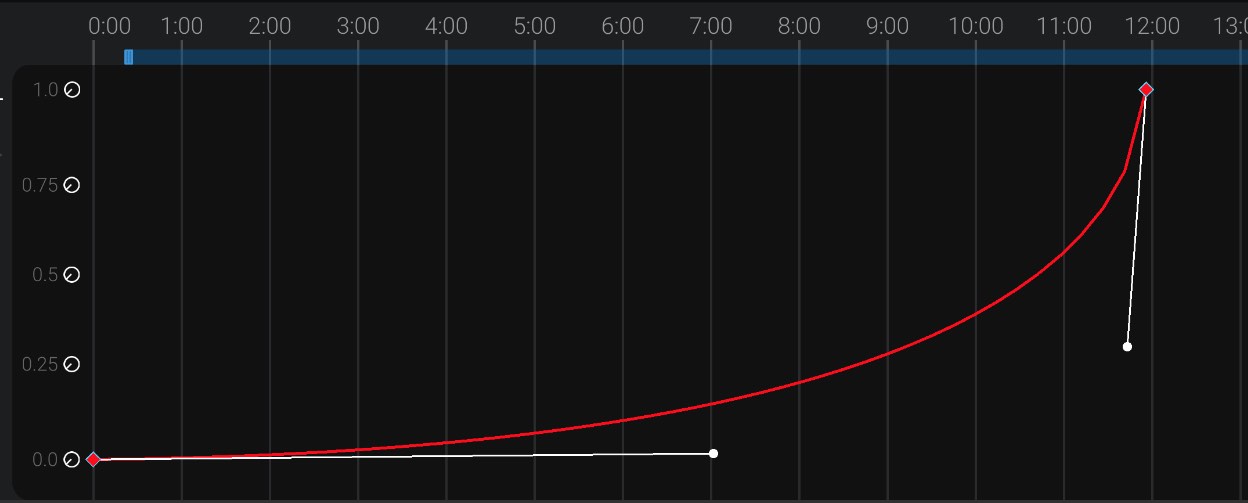
Notice how in the above example the slope of the curve is gradual and then suddenly stops. You’d see the same behavior in the movement of the robot.
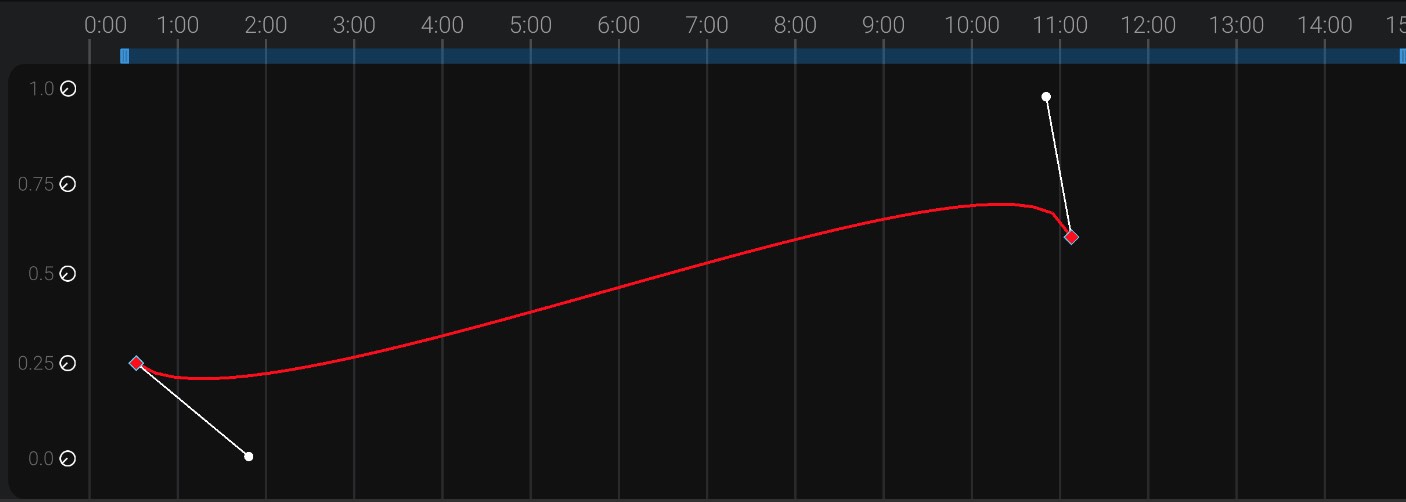
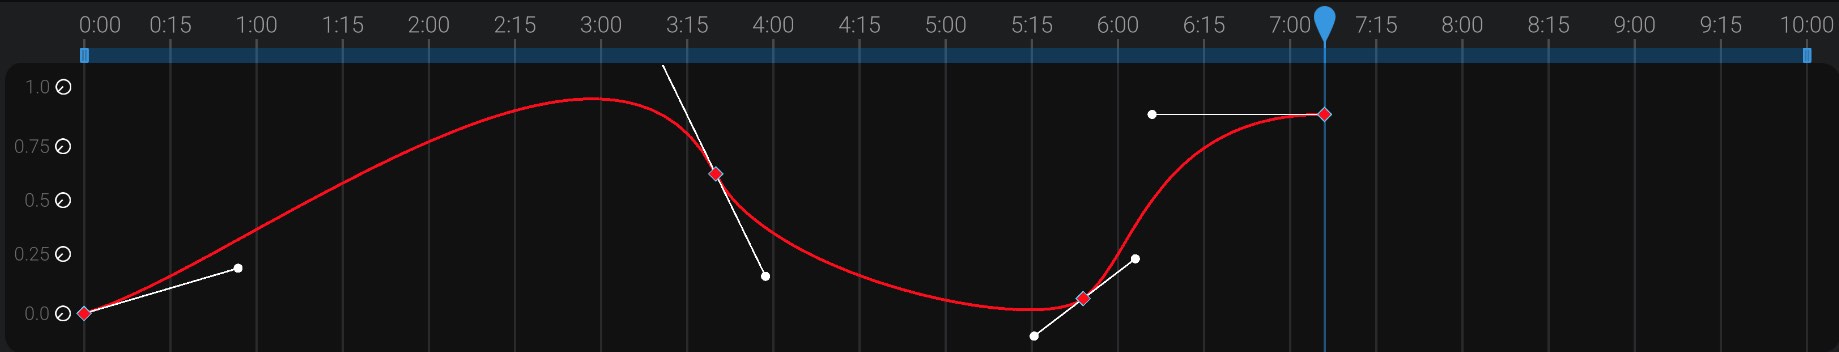
Finally, here’s a hand that moves back slightly before springing forward to its final resting spot (overshooting a bit on the way).
Each track in the graph view is assigned a color. You can see the color of the track in the list of tracks on the left side of the animation window.
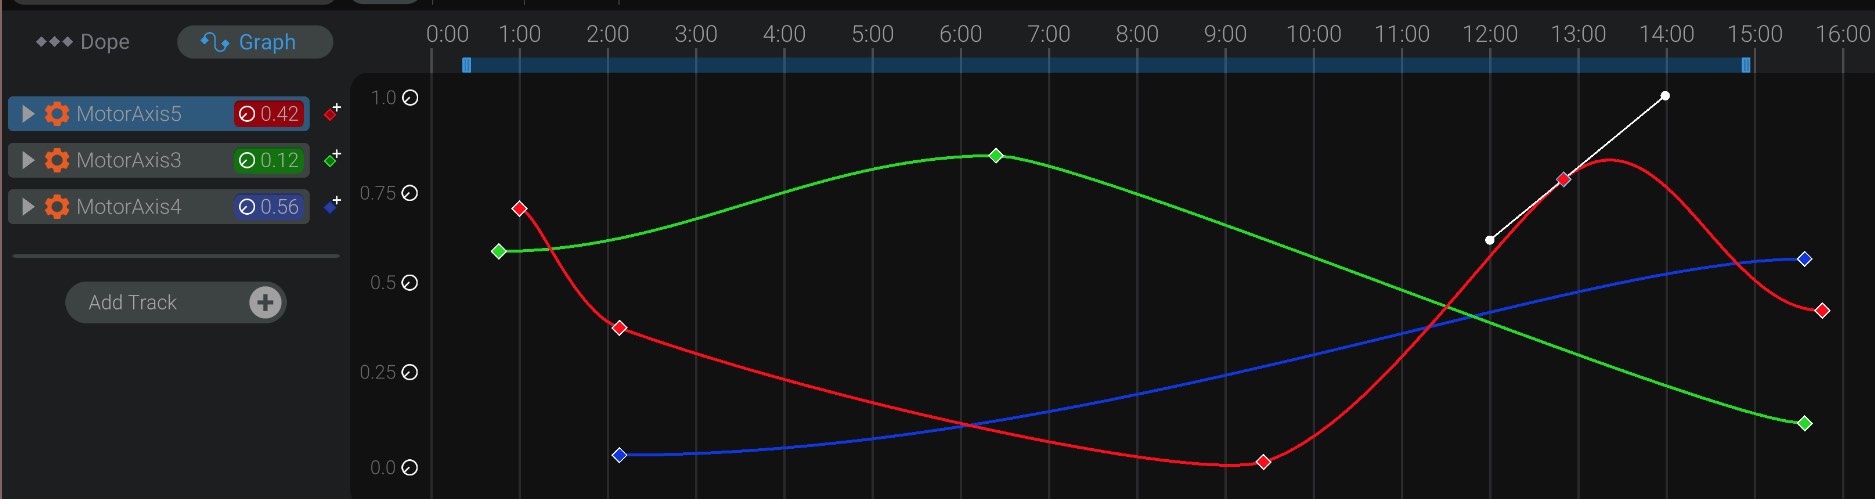
The corresponding chart in the graph view for that track shares the same color.
Only animation tracks that have movement are shown in the graph view. Audio tracks are not shown while in graph view. To view audio keyframes and waveforms, move back to the dope sheet view.
Just like the dope sheet, you can select, delete, and move keyframes in the graph view. However, in this view, you can move keyframes in both dimensions: time and value.
Moving a keyframe left and right changes its time, just like in the dope sheet view. Moving a keyframe up and down changes its value.
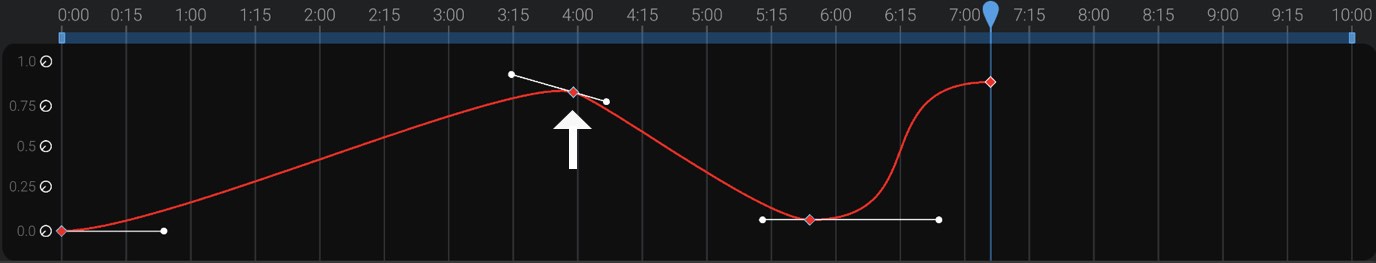
You can also change the slope and shape of the curve. Select any keyframes in the graph view, and you’ll see the interpolation handles for that keyframe.
The handles allow you to sculpt the line of the animation using Bézier curves. Dragging on the handles of each keyframe allows you to sculpt the shape of the curve as the motion moves from that keyframe to the next (or from the previous keyframe into this one).
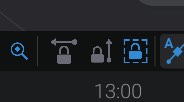
If you want to only change the time of the selected keyframes when dragging them, or instead only change the movement value, you can lock the drag axis in the graph view:
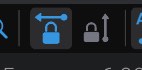
Click the “left/right” lock to toggle only changing the time value of selected keyframes.
Click the “up/down” lock to toggle only changing the movement value of selected keyframes.
Only one lock can be enabled at a time. To go back to no locks, click the currently enabled lock.
The third button in the lock section allows you to lock your selected tracks or parts while in graph view, and prevent clearing your selection by clicking outside of any keyframe in the graph view. This is useful if you want to make sure you stay selected on certain tracks while working on them and prevent a misclick clearing your selection. You can still modify your selection using the track list and by clicking on parts in the 3D view.
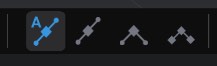
Each keyframe has one of four interpolation settings: auto smooth, smooth, broken, or linear.
You can change the interpolation setting for a keyframe by selecting it and clicking one of the four interpolation type buttons.
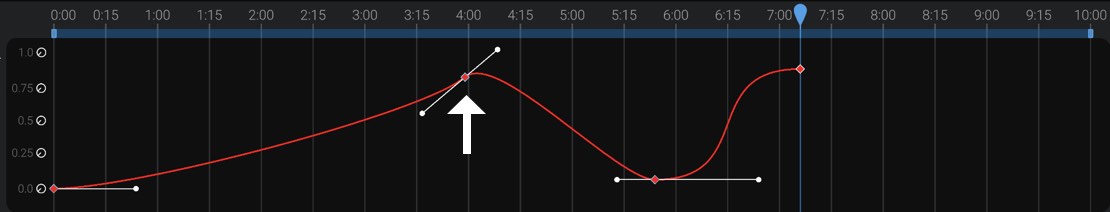
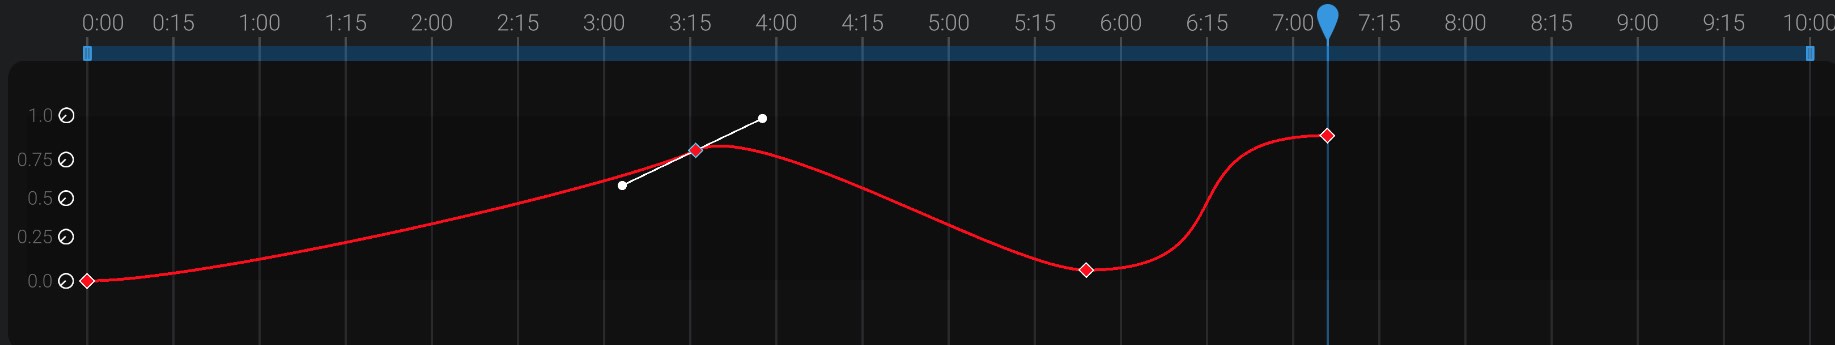
By default, keyframes are created with an auto smooth interpolation. This means as you drag one side handle of the keyframe, the other handle moves inversely, so as to result in a smooth curve. As you change the frame of a keyframe, the curve will stay the same shape.
Here you can see that when the handle of the second keyframe is moved, both sides move together:
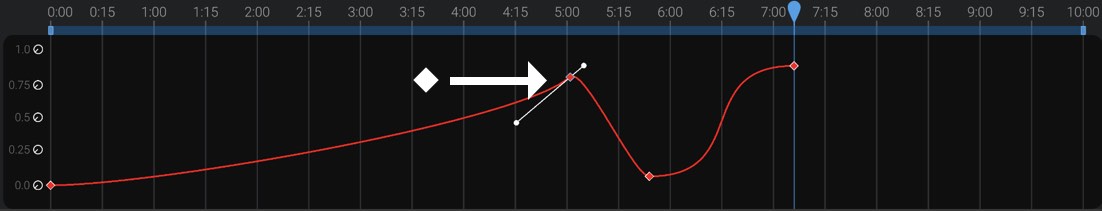
Here you can see how the handle changes its proportions as you change the keyframe’s time in order to maintain the shape of the curve.
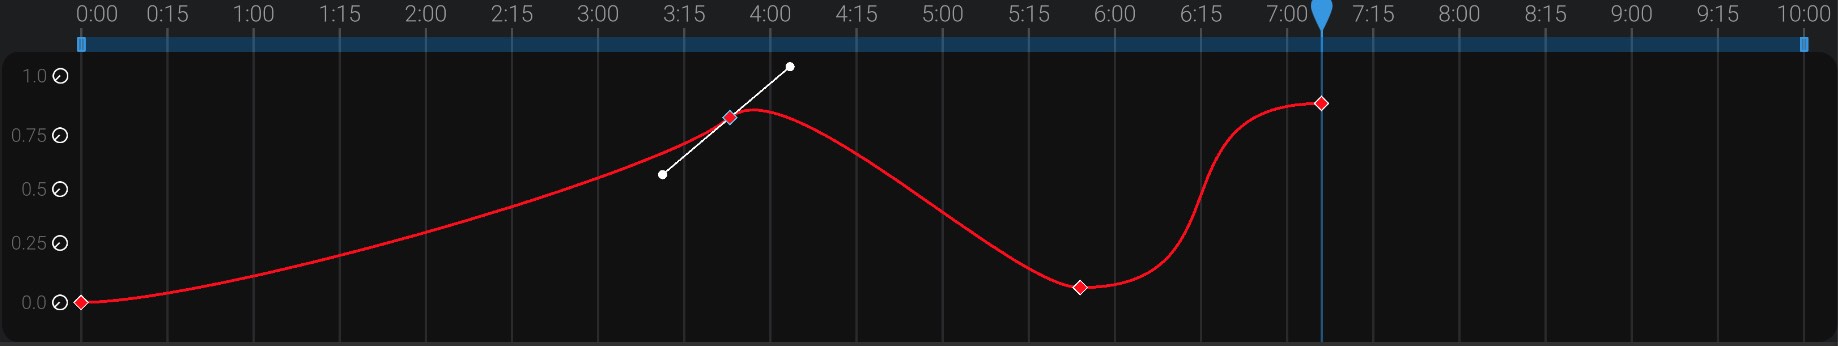
Smooth interpolation behaves like auto smooth interpolation. As you move one side of a handle, the other side moves inversely.
However, smooth interpolation will not change its proportions as you change a keyframe’s frame.
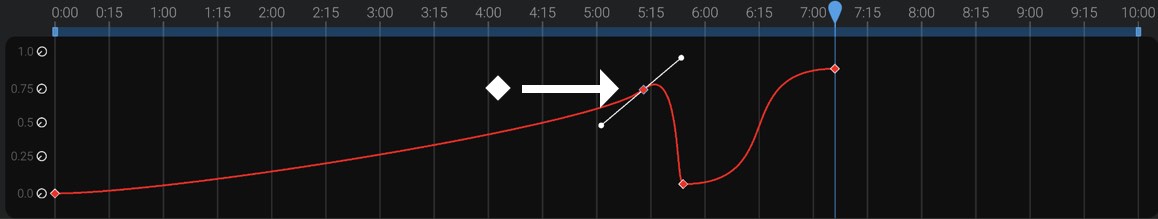
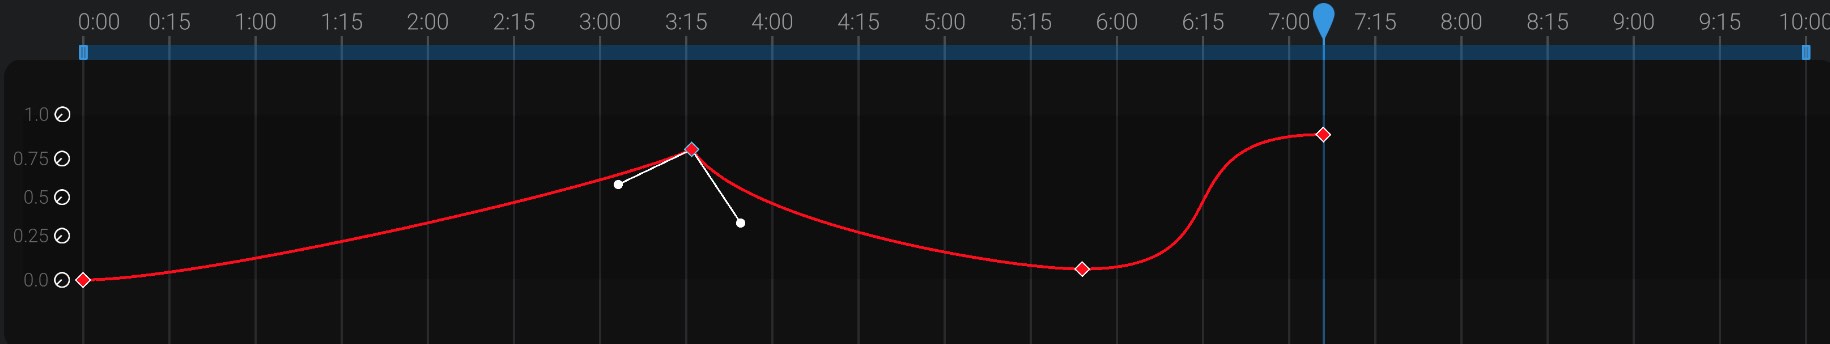
Broken interpolation does not adjust the handles at all as you manipulate them. This allows you to have a sudden change in direction.
Linear interpolation automatically adjusts the curve between keyframes to be at a constant rate.
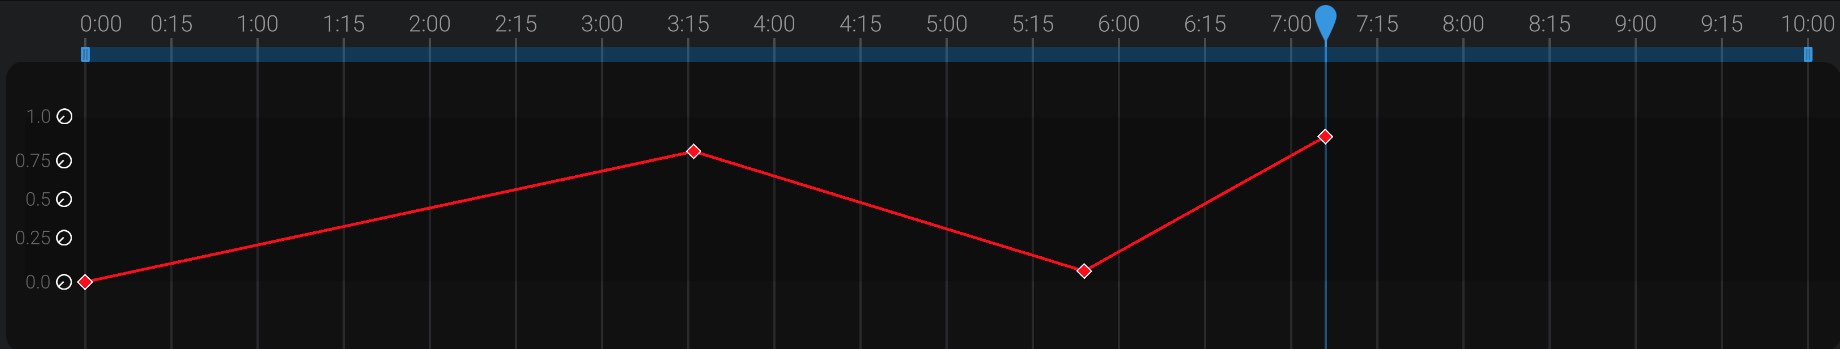
When you convert a keyframe to linear, you indicate if you want in (the left handle), out (the right handle), or both sides of the handle to be linear.
As you edit keyframes in the graph, you’ll be constrained to adjust the movement of the keyframe between 0 and 1. This means it will always be visible in the default graph view.
However, it’s easy to move the handles of a keyframe out of the default view. You can change the scale of the graph view with the Y slider:
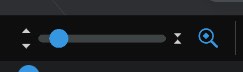
Additionally, you can press the Z key or press the auto zoom button to automatically adjust the zoom of the graph view to show all selected handles.

While viewing the curves of an animation, Bottango will let you know if a movement is faster than the maximum speed you entered for the associated motor in Motor Basic Configurations:
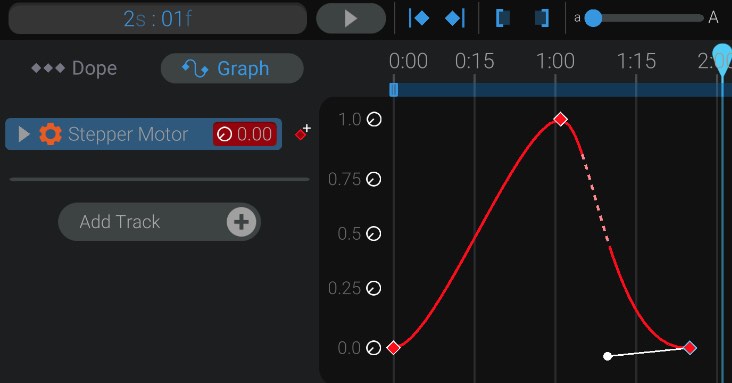
Here you can see that on the downward portion of the curve, the stepper motor would need to move faster than you allowed in the configuration of that motor. This is visualized by the dashed portion of the curve.
You can still play this animation, and your motor will move at its maximum speed (but no faster) to try and catch up. The end result will not move faster than your maximum speed, however it may not be in perfect synchronization with what you see and animate in Bottango.
You should, when possible, change the maximum speed of the motor, or slow down the movement when you see this warning.